JS: DOM API
Theory: DevTools
DevTools is a powerful instrument for debugging and analyzing what's happening on the page. Frontend development is impossible without it.
Modern browsers are already fully equipped with these tools. You just need to find them in the menu and activate it. And it's worth spending time and exploring the capabilities of DevTools.
We can use DevTools for so many things, but this course isn't enough to study all its possibilities. The Internet is full of articles all about the most powerful ways to use DevTools, and its hidden features. So, we'll only go through the basic ones here.
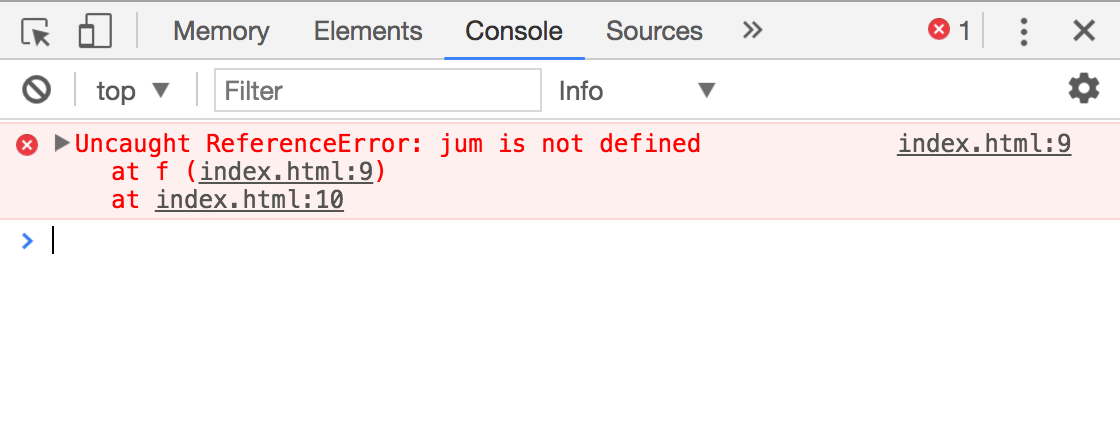
Error analysis

All errors that occur in browser-based JavaScript are output to the console. You can view them and open the source code to see where the error appeared.
Selected item
After choosing an element in this way, you can go to the console tab and type $0. It is how you can get access to this element.
Search

You can use the $() function to simplify the search for elements by a selector. Let's compare:
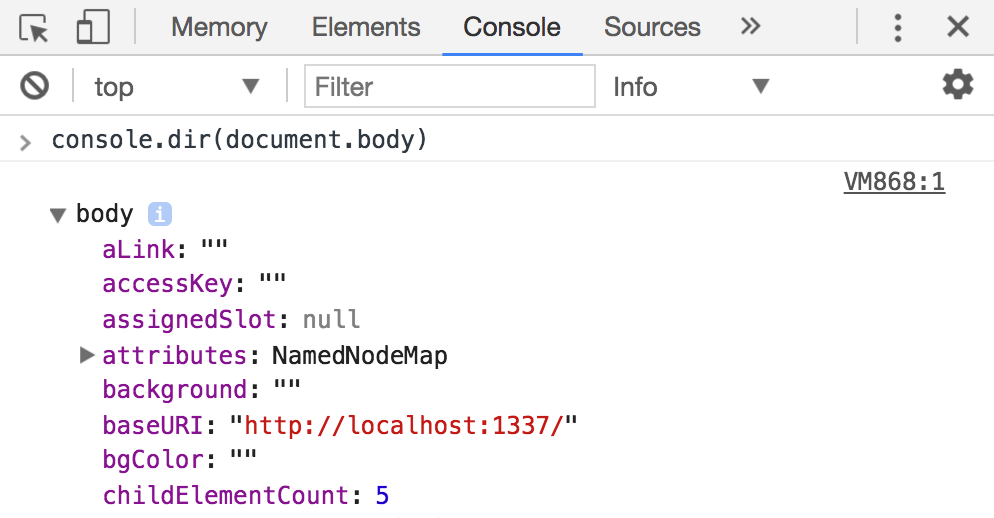
console.dir

The function console.dir is useful too. It outputs DOM nodes in a format that's convenient for analysis.


